
The new frontier
in drayage.
TruckerZoom's XMap is the first TMS map with true spatial intelligence for commercial trucking. Built for the entire drayage ecosystem, XMap transforms terminals, yards, warehouses, depots, and dispatch data into a spatial operating environment, enabling dispatch on a linear timeline rather than a traditional tabular board.
A day you can read at a glance.
Each driver is shown on the timeline. The horizontal lines indicate the time of day under which stops fall, with either colored pins for completed work or grey pins for pending work, so the status of a driver or an order is visible before a single order is opened.
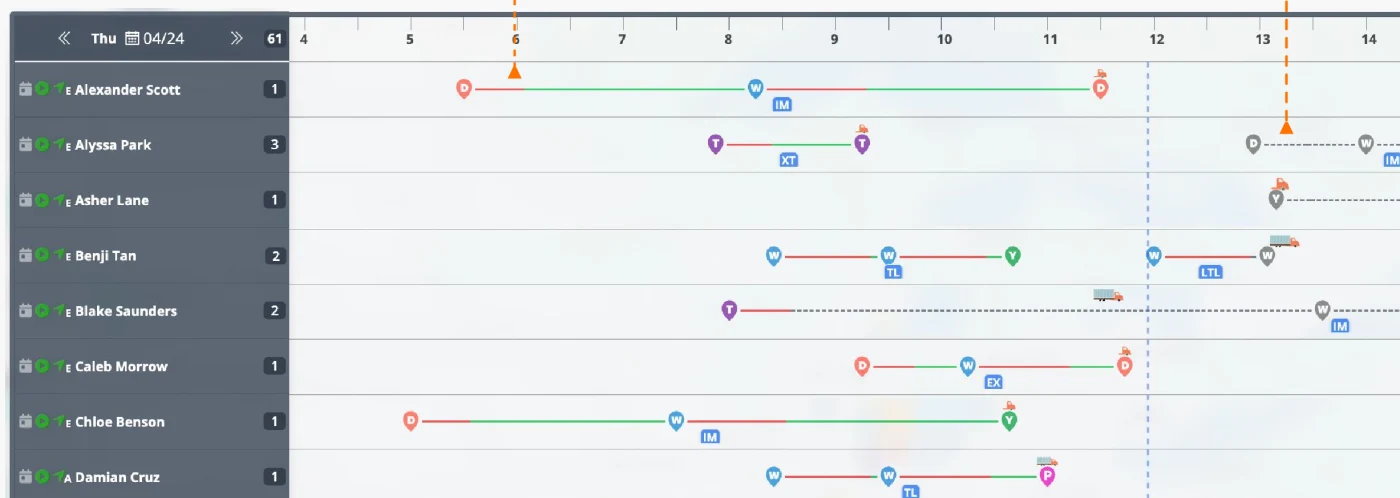
XMap reads ELD and dispatch-board data and runs without any additional input.
Every location has a shape on the map.
Terminal
A facility where import-loaded containers are picked up to begin a delivery or export-loaded containers are returned upon completion of loading at a warehouse. Terminals are operated by ports and railroads.
Warehouse
The location where cargo is either loaded, for export orders, or unloaded, for import orders.
Depot
A storage location for steamship line containers, where truck carriers pick up or return empties depending on the order type.
Yard
A facility operated by the truck carrier where trucks, containers and chassis are parked while awaiting their next pick up.
Place
Any other location involved in the process, such as a weigh scale, customs warehouse or repair facility, which is not typically part of the standard delivery workflow.
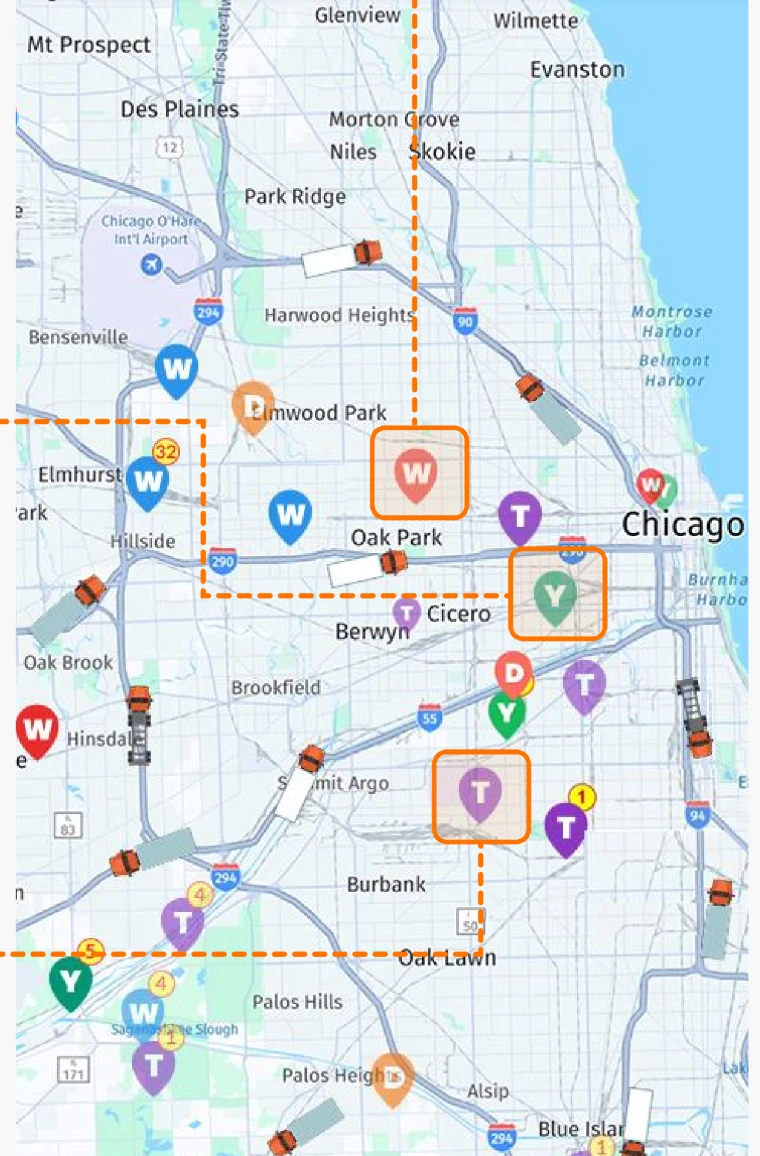
A pin with a number carries that many pending activities for the day. When the transactions are done, the number disappears.
Four truck states, readable at a glance.
Loaded
Container on chassis, cargo aboard.

Bare chassis
Chassis moving without a container.

Empty
Container on chassis, no cargo.

Bobtail
Tractor moving with no chassis attached.

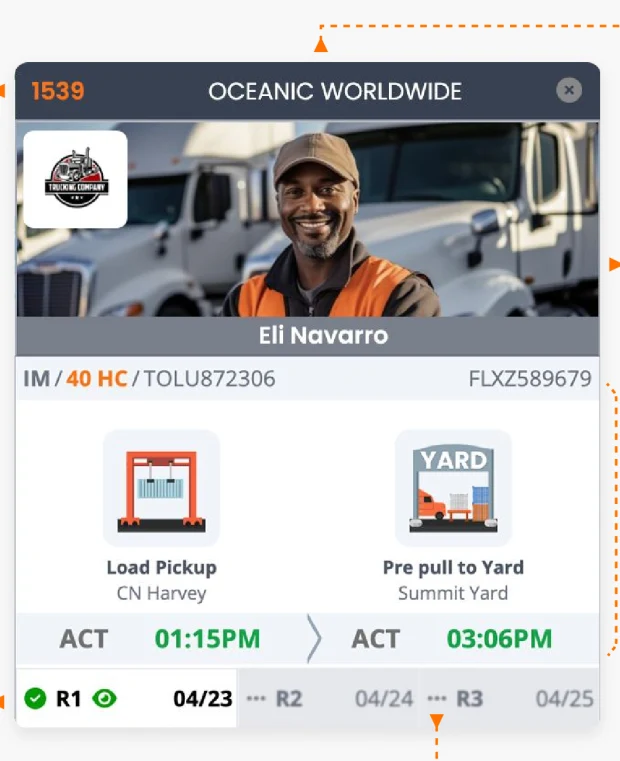
The whole order, on one card.
A visual summary of the delivery order. Each route is represented iconographically and can be opened by tabbing the route number at the bottom of the card.
For every route the card shows the assigned driver's name and photo, along with a clickable ID that opens the full delivery order as a map overlay, so dispatchers never lose sight of the original view.
A spatial operating environment.
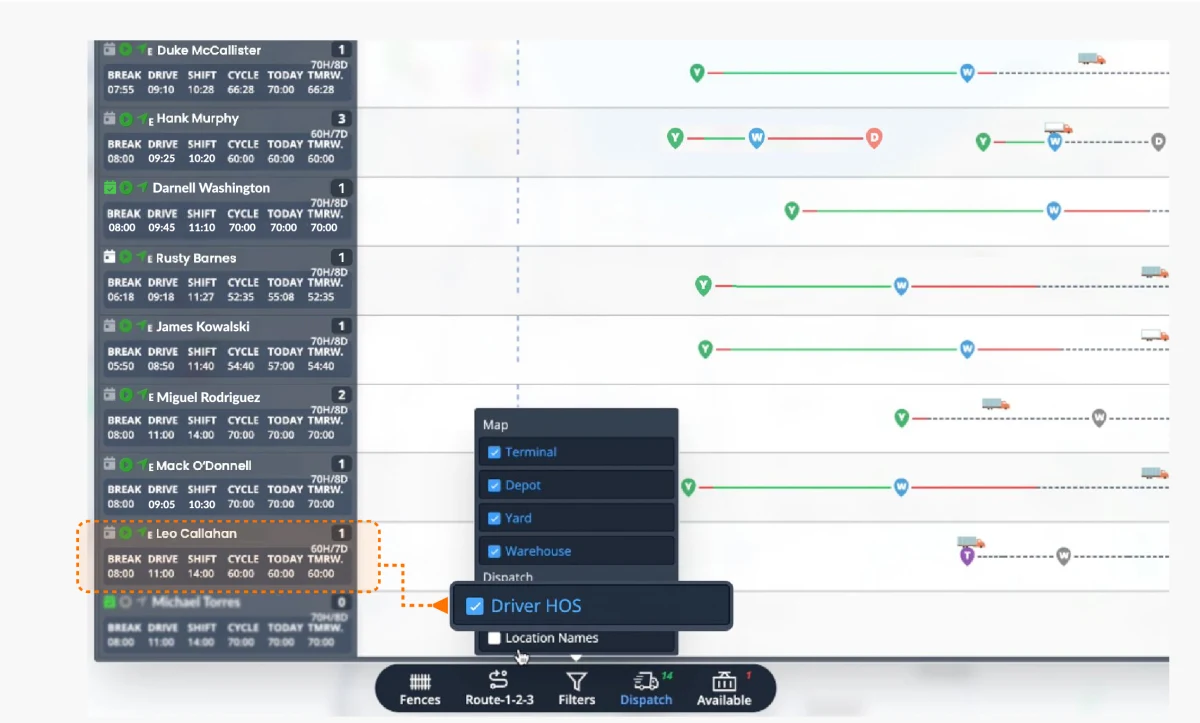
Driver hours on the same view
Break, drive, shift, and cycle. Today's hours-of-service information sits underneath each driver's name, so the dispatcher can see the remaining driving hours at a glance.
Pending activity counts
A number appended to a location pin is the count of pending activities there. Once everything is complete the number disappears, so an unfinished day is visible on the map itself.
Geofences and map controls
Filter terminals, depots, yards and warehouses on and off, add location names, and overlay driver hours. The map becomes the working surface rather than a picture of one.
Gate activity and on-site inventory
Click any location to see its gate activity for the day, current inventory and pre-alerts, without leaving the map.
Built for the entire
drayage ecosystem.
Terminals, truck yards, warehouses, depots and dispatch data, in one spatial view.